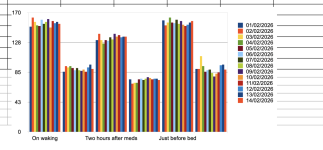
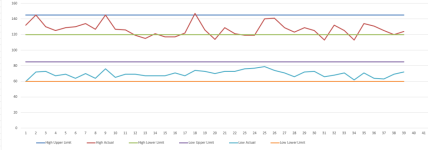
I have been taking blood pressure readings three times a day. The first when I wake up (high BP), the second later in the day after the meds were taken a few hours before (normal BP) and the third set (high BP) just before going to bed.
These readings suggest to this layman that the BP meds are running 'out of puff' by the end of the day and so the BP is not controlled during the night. I'd like to present to my GP a chart like this
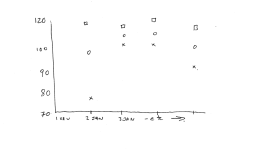
The circles could be the first set of readings, say, crosses the second and square the third.
Can this sort of thing be done in a spreadsheet ? Ideally Apple Numbers
TIA
These readings suggest to this layman that the BP meds are running 'out of puff' by the end of the day and so the BP is not controlled during the night. I'd like to present to my GP a chart like this
The circles could be the first set of readings, say, crosses the second and square the third.
Can this sort of thing be done in a spreadsheet ? Ideally Apple Numbers
TIA